Director of Public Health Annual Report 2022: Preventing heart disease and stroke in Buckinghamshire
Foreword
This year my annual report is about cardiovascular disease in Buckinghamshire and how we can prevent it. Cardiovascular disease causes heart disease, stroke and the second commonest type of dementia -vascular dementia. It causes 1 in 5 of all deaths in Buckinghamshire and is the major contributor to the gap in life expectancy between people living in our most deprived and least deprived areas. Whilst cardiovascular disease can affect anyone, it is more common in men, some ethnic groups, such as South Asian and black ethnic groups and people living in more deprived areas. However, cardiovascular disease is not inevitable and there is a lot we can do as individuals, communities and organisations in Buckinghamshire to prevent it.
The main modifiable risk factors for cardiovascular disease include behavioural risk factors, such as smoking, ‘clinical’ risk factors and social and environmental risk factors. People can take action themselves on some risk factors but there is more that organisations and society can do to help people do this.
For the behavioural risk factors a whole system approach that makes healthy choices the easy choices is more effective in changing behaviours than focusing on the individual alone. Raising awareness of other risk factors is also important. Many people do not know they have ‘clinical’ risk factors, such as high blood pressure, high cholesterol or diabetes, as they may not have any symptoms. However, if these conditions are found early there are very effective treatments to manage them and reduce the risk of people developing cardiovascular disease.
Finally, the conditions in which people live and work can also impact on their risk of cardiovascular disease. The social and environmental risk factors mean that a diverse range of people and organisations can impact on our residents’ risk of cardiovascular disease through their role in planning, transport, air quality, housing conditions and stress at work.
Addressing the key risk factors successfully will improve health in many additional ways, including reducing the risk of cancer, diabetes, dementia, musculoskeletal problems and poor mental health. It will also produce many other benefits, including improving child health and learning, economic productivity, improving air quality, helping to mitigate the impacts of climate change and improving quality of life for our residents. To do this we will need action from a wide range of partners, including communities and individuals themselves, local government, the NHS, voluntary sector, businesses and national government but the benefits are definitely worth it!
Dr. Jane O’Grady
Director of Public Health and Community Safety, Buckinghamshire Council
Acknowledgements
Thanks to Abigail Moffat, Caroline Thickens, David Stoye, Elizabeth Biggs, Elkie Dolling, Emma Dillner, Josiane Dyson, Layla Ravey, Louise Hurst, Lucie Smith, Michelle Baragona, Nicola Higgins, Sally Hone, Sarah Preston, Sarah Winchester, Thilina Jayatilleke, Tiffany Burch and Victoria Cooke.
How to use this report
In addition to the report, there are a few tools to help with understanding the content:
A glossary is available at the end of the document to clarify some of the technical language used
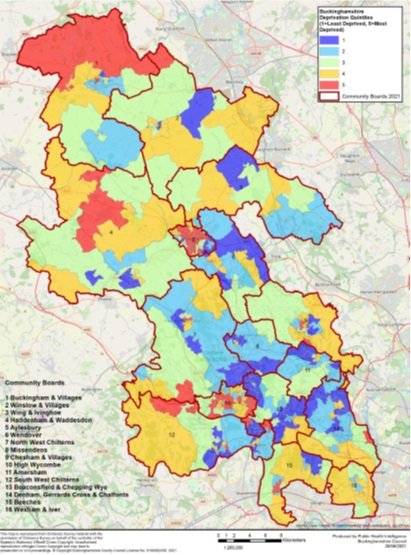
Analysis in this report sometimes mentions ‘deprivation’, ‘least deprived’ and ‘most deprived’. Deprivation in England is measured using the Index of Multiple Deprivation (IMD). It is an official measure of relative deprivation and defines deprivation to include a wide range of an individual’s living conditions. Within Buckinghamshire, the population for our county is split into five even groups (quintiles) containing 20% of the population each, based on the deprivation score of the areas they live in. When the term ‘least deprived’ is used, it means the 20% of the Buckinghamshire population who live in the least deprived areas within the county using the Index of Multiple Deprivation. The ‘most deprived’ means the 20% of the Buckinghamshire resident who live in the most deprived areas within the county using the Index of Multiple Deprivation. A map of deprivation quintiles for the county is on the next page.
Some of the analysis also mentions community boards. These are boards that allow council members and communities to come together to address local issues that matter to them. There are 16 community boards across the county. A map for the boards is below.

- Buckingham and Villages
- Winslow and Villages
- Haddenham and Waddesdon
- Wing and Ivinghoe
- Aylesbury
- Wendover
- North West Chilterns
- Chesham and Villages
- Missendens
- Amersham
- High Wycombe
- South West Chilterns
- Beaconsfield and Chepping Wye
- Denham, Gerrards Cross and Chalfonts
- Beeches
- Wexham and The Ivers